
지식 창고
canvas prog graph draw 본문
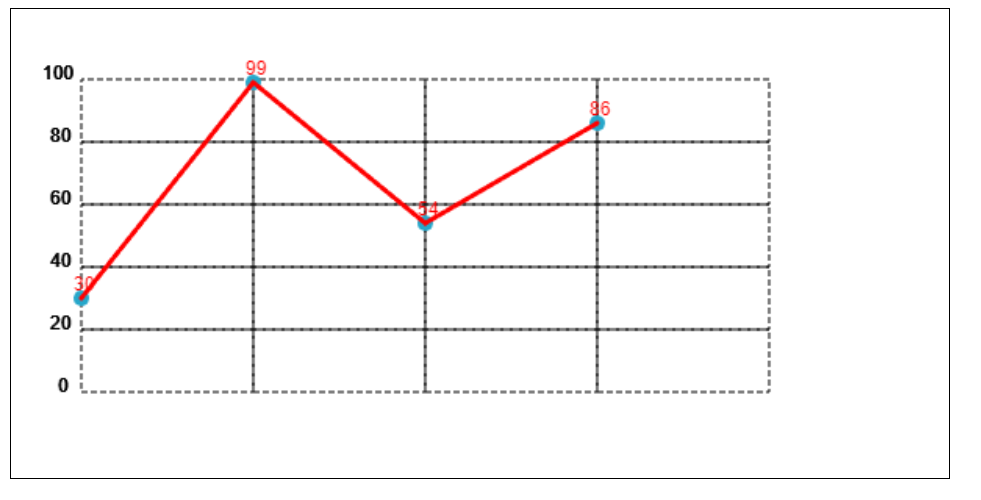
| <!DOCTYPE html> <html> <head> <meta charset="utf-8"/> </head> <style type="text/css"> #topo_graph { border: 1px solid black; } </style> <script type="application/javascript"> function drawGraph(value) { var canvas = document.getElementById('topo_graph'); if (canvas.getContext) { var ctx = canvas.getContext('2d'); var canvasWidth = 600; var canvasHeight = 300; ctx.clearRect(0,0, canvasWidth, canvasHeight); <!-- ctx.fillRect(25, 25, 100, 100); --> <!-- ctx.clearRect(45, 45, 60, 60); --> <!-- ctx.strokeRect(50, 50, 50, 50); --> <!-- ctx.beginPath(); --> <!-- ctx.arc(95, 50, 40, 0, 2 * Math.PI); --> <!-- ctx.fillStyle = "rgba(0, 0, 200, 0.5)"; --> <!-- ctx.stroke(); --> <!-- ctx.closePath(); --> <!-- ctx.beginPath(); --> <!-- ctx.font = "30px Arial"; --> <!-- ctx.fillText("Hello World", 10, 50); --> <!-- ctx.closePath(); --> var margin_top = 45; var margin_left = 45; ctx.beginPath(); ctx.font = "12px Arial"; ctx.setLineDash( [4,2] ); ctx.lineDashOffset = 2; for(var i=0; i<4; i++) { ctx.fillText("100", margin_left - 25, margin_top+(40*0)); ctx.strokeRect(margin_left + (110*i), margin_top+(40*0), 110, 40); ctx.fillText("80", margin_left - 20, margin_top+(40*1)); ctx.strokeRect(margin_left + (110*i), margin_top+(40*1), 110, 40); ctx.fillText("60", margin_left - 20, margin_top+(40*2)); ctx.strokeRect(margin_left + (110*i), margin_top+(40*2), 110, 40); ctx.fillText("40", margin_left - 20, margin_top+(40*3)); ctx.strokeRect(margin_left + (110*i), margin_top+(40*3), 110, 40); ctx.fillText("20", margin_left - 20, margin_top+(40*4)); ctx.strokeRect(margin_left + (110*i), margin_top+(40*4), 110, 40); ctx.fillText("0", margin_left - 15, margin_top+(40*5)); } ctx.closePath(); /* 0 100 40 80 80 60 120 40 160 20 200 0 0 200-0 100 200-100 */ var minValue = 0; var maxValue = 100; ctx.fillStyle = "red"; ctx.fillText(String(value), margin_left-5, margin_top + ((maxValue - value) * 2) - 5); drawCircle(ctx, margin_left, margin_top + ((maxValue - value) * 2), true, "#26A7CA", 5); ctx.fillStyle = "red"; ctx.fillText(String(99), margin_left + (110*1)-5, margin_top + ((maxValue - 99) * 2) - 5); drawCircle(ctx, margin_left + (110*1), margin_top + ((maxValue - 99) * 2), true, "#26A7CA", 5); ctx.fillStyle = "red"; ctx.fillText(String(54), margin_left + (110*2)-5, margin_top + ((maxValue - 54) * 2) - 5); drawCircle(ctx, margin_left + (110*2), margin_top + ((maxValue - 54) * 2), true, "#26A7CA", 5); ctx.fillStyle = "red"; ctx.fillText(String(86), margin_left + (110*3)-5, margin_top + ((maxValue - 86) * 2) - 5); drawCircle(ctx, margin_left + (110*3), margin_top + ((maxValue - 86) * 2), true, "#26A7CA", 5); drawLine(ctx, margin_left, margin_top + ((maxValue - value) * 2), margin_left + (110*1), margin_top + ((maxValue - 99) * 2), '#ff0000'); drawLine(ctx, margin_left + (110*1), margin_top + ((maxValue - 99) * 2), margin_left + (110*2), margin_top + ((maxValue - 54) * 2), '#ff0000'); drawLine(ctx, margin_left + (110*2), margin_top + ((maxValue - 54) * 2), margin_left + (110*3), margin_top + ((maxValue - 86) * 2), '#ff0000'); /* ctx.beginPath(); ctx.arc(100, 75, 50, 0, 2 * Math.PI); ctx.strokeStyle = "#FF0000"; ctx.stroke(); ctx.beginPath(); ctx.arc(210, 75, 50, 0, 2 * Math.PI); ctx.strokeStyle = "blue"; ctx.stroke(); ctx.closePath(); var centreX =100; var centreY = 150; ctx.beginPath(); ctx.fillStyle = "#16AA55"; //green ctx.moveTo(centreX, centreY); ctx.arc(centreX, centreY,100, Math.PI * 0.01, Math.PI * 1, false); ctx.lineTo(centreX, centreY); ctx.fill(); ctx.beginPath(); ctx.fillStyle = "#26A7CA"; ctx.moveTo(centreX, centreY); ctx.arc(centreX, centreY, 100, Math.PI * 1, Math.PI * 2.01, false); ctx.lineTo(centreX, centreY); ctx.fill(); */ } } function drawCircle(ctx, centerX, centerY, isFill, color, radius) { ctx.beginPath(); if(isFill) ctx.fillStyle = color; else ctx.strokeStyle = color; ctx.moveTo(centerX, centerY); ctx.arc(centerX, centerY, radius, Math.PI * 0.01, Math.PI * 2, false); ctx.fill(); } function drawLine(ctx, sx, sy, ex, ey, color) { ctx.beginPath(); ctx.strokeStyle = color; ctx.lineWidth=3; ctx.lineCap = 'round'; ctx.lineJoin = 'bevel'; ctx.moveTo(sx, sy); ctx.lineTo(ex, ey); ctx.stroke(); } </script> <body onload="drawGraph(30);"> <canvas id="topo_graph" width="600" height="300"></canvas> </body> </html> |
'프로그래밍 > HTML, CSS' 카테고리의 다른 글
| onkeypress, onkeyup (0) | 2021.10.07 |
|---|---|
| 툴팁 사용 방법 (0) | 2021.10.07 |
| custom button (0) | 2021.09.21 |
| 유용한 팁 (0) | 2021.09.15 |
| 크롬 WEB 디버깅 방법 (0) | 2021.08.29 |
'프로그래밍/HTML, CSS' Related Articles
more


Comments